
You know you should be measuring the success of your Facebook and Google ads.
You’ve probably looked at some of the analytics in an attempt to make sense of it all.
Maybe you even understand some of what you’re looking at.
But how do you know what Google and Facebook analytics are the most important to track?
Better question: How do you know if the analytics you’re seeing are good or bad?
Today, we’re not only talking about what analytics to track, but also how you can tell if your ads are successful.
Enjoy the journey to more informed Facebook and Google advertising!
Definitions of Popular Analytics
Before we get started, I would like to give you a handy guide of popular analytics and their definitions for you to reference as you go along.
Please read over each of these–the nuances will help you understand their value!
Reach – The number of unique people who saw your ad.
Impressions – The number of times your ad was shown. This is often a higher number than reach because some people will be shown your ad multiple times. They say that someone must see an ad seven times before they become aware of it, so you want this!
Engagement (Facebook) – The number of likes, comments, and shares on your ad.
Engagement Rate (Facebook) – The number of likes, comments, and shares on your ad divided by the number of people who saw your ad.
Clicks – The number of clicks on your ad not including likes, comments, and shares. For example, clicking to enlarge a photo, play a video, or expand an ad.
Link Clicks – The number of clicks on your ad to your profile or website.
Click-Through-Rate (CTR) – The number of link clicks on your ad divided by the number of times your ad was shown.
Cost-Per-Click (CPC) – The amount of money you spend for each link click on your ad.
Hopefully, these definitions help you as we cover what analytics to track today!
Facebook Analytics to Track
If you’re advertising on Facebook, your goal is to get as much engagement as possible in terms of likes, comments, shares, and ultimately, clicks through to your profile or website.
And you want to do it for as little money as possible.
Facebook analytics like reach and impressions can give you context for what is going on with your ad, but the gold is in the numbers on link clicks and cost.
This is especially true for a lead generation campaign where the objective is to generate link clicks that convert to leads for your business.
The cheaper the link click, the lower the cost of acquisition per lead.
The only exception is a brand awareness campaign where you may simply be measuring eyeballs on the ad (reach and impressions).
Two of the most important Facebook analytics for measuring link clicks and cost are click-through-rate (CTR) and cost-per-click (CPC).
For this reason, online advertising tool WordStream publishes a report on industry benchmarks for these Facebook analytics that they keep updated throughout the year.
How do you know if your Facebook analytics are good or bad?
Measure them against those of other companies advertising in your industry!
Here is the industry benchmark infographic for click-through-rate:
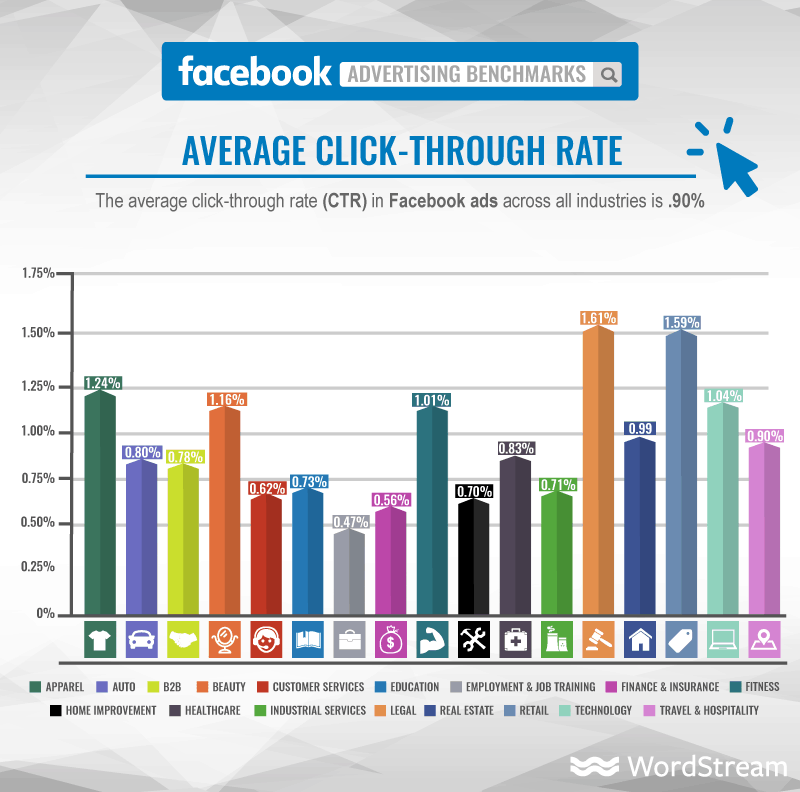
So, for instance, if you are in the consumer services industry, a click-through-rate of OVER 0.62% would be great!
That would mean your Facebook ads are performing above average for your industry.
It is important to note the distinction between click-through-rate and cost-per-click.
Although you want to see a HIGH click-through-rate, you want to see a LOW cost-per-click.
Here is WordStream’s industry benchmark infographic for cost-per-click:
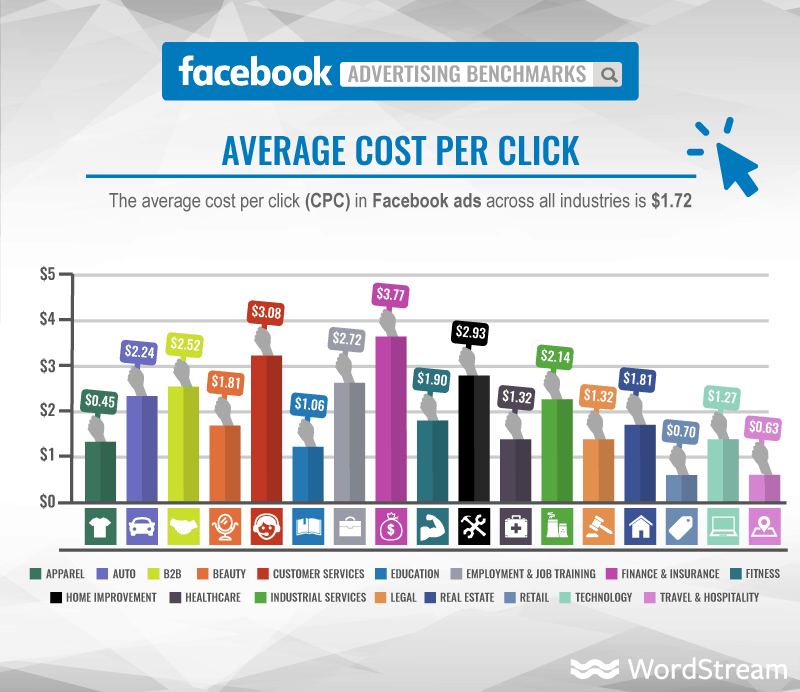
So, in this case, if you are in the consumer services industry, a cost-per-click of UNDER $3.08 would be fantastic!
These numbers give you an idea of how Facebook ads perform in various industries as well as what you can expect from your ads.
They provide valuable context.
A consumer services company shouldn’t complain about a cost-per-click of $2 but a retail company should absolutely look at bringing that cost down!
Now, let’s turn the page to Google ads and analytics for a bit.
Google AdWords Analytics to Track
We have included a discussion of Google ads and analytics in this article because they are a part of an integrated digital advertising strategy and they are very similar to Facebook analytics.
Similar to Facebook ads, with Google ads you’ll want to be tracking link clicks and cost, although there are other analytics like reach and impressions that provide context.
For Google ads, you’ll want to track exactly the same two analytics, click-through-rate (CTR) and cost-per-click (CPC)!
And in the same way, as they do for Facebook, WordStream publishes industry benchmarks for Google too.
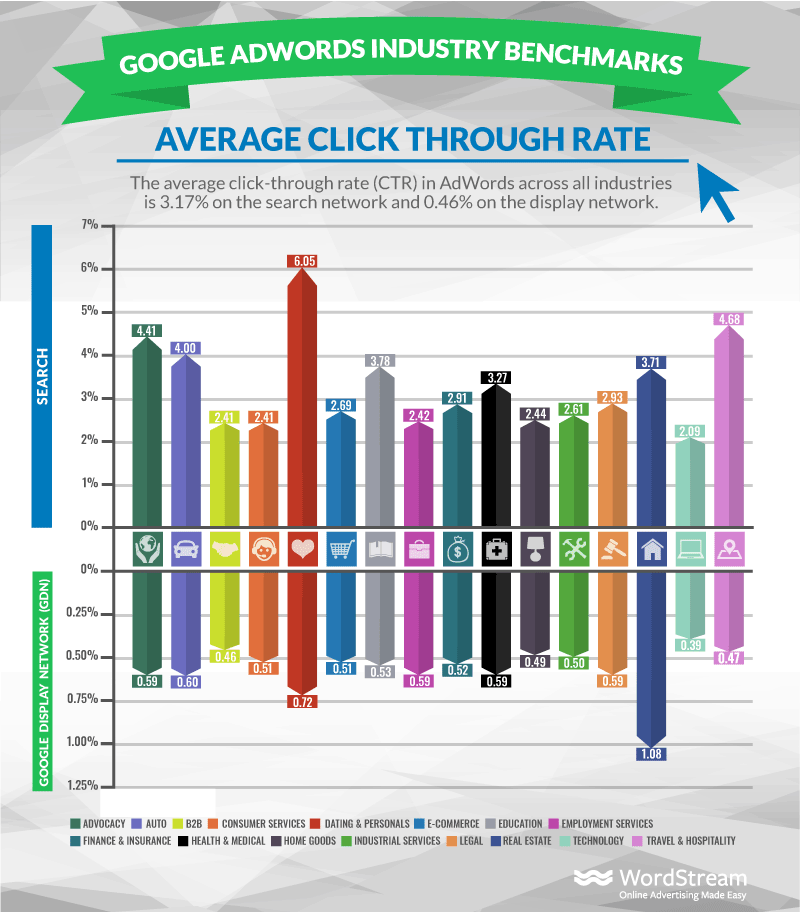
Here are the Google industry benchmarks for click-through-rate:
And here are the Google industry benchmarks for cost-per-click:
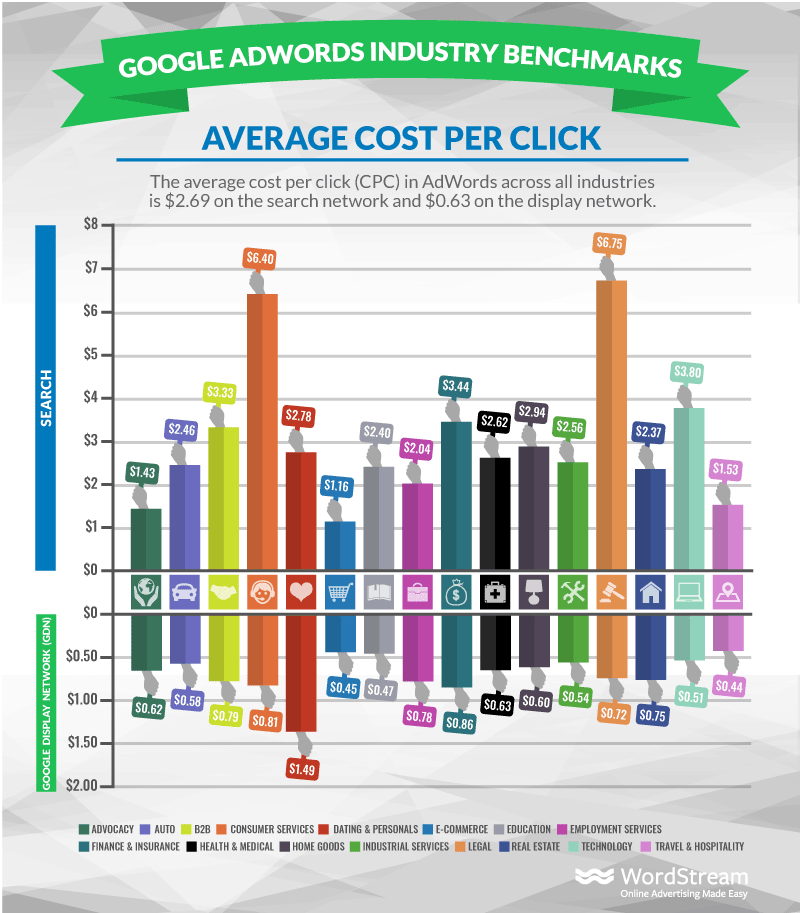
Just like with Facebook analytics, you want to see a HIGH click-through-rate and a LOW cost-per-click for your industry with Google.
Something a little bit different that you’ll notice here is the distinction between the analytics for Google “search” advertising and advertising through the “Google display network” (see the blue and green bars in the left column).
Your analytics will look a little different depending on which kind of Google advertising you’re using, so pay attention!
In conclusion, click-through-rate and cost-per-click are the analytics you should track for both Facebook and Google ads, although reach and impressions can show you how many people are looking at your ads and how many times they see them.
Click-through-rate and cost-per-click are analytics that combine some of the most important information to create the most comprehensive picture of what is going on with your ads.
If your Google or Facebook analytics are above industry standards, congratulations!
You’re right on track.
If they are not, you may want to consider testing alternative images or copy until the numbers are where they should be.
We would love to chat with you about how your Facebook or Google ads are performing as well as offer some recommendations for how to make them even more successful.
Our team of Facebook and Google certified specialists have been running, A/B testing, and tracking analytics on ads for years!
You can schedule a free consultation with President Adrienne Wilkerson or VP of Marketing Jennifer Christensen using their automated scheduler, available here.
We look forward to hearing from you!
Best of luck as you continue learning how to track the analytics on your Facebook or Google ads!